Google+
Showing posts with label ict4ag13. Show all posts

Monday, December 02, 2013

Do more with your tweets - Social reporting at ICT4Ag

In my previous post about tracking the online buzz generated around the ICT4Ag conference I’ve mentioned a couple of the tools that we used in the social reporting of the event. At the ICT4Ag conference, blogs, workspaces, Twitter and the other ‘usual suspects’ formed the backbone of our technology infrastructure.

However, besides these tested and tried solutions, this time around I wanted to experiment with some new applications around the edges of the process.

In this and the following posts I’m going to zoom in and focus on technology, presenting some new (to me at least) applications that I’ve used and what I’ve learnt - and what I would do different next time to further develop my own practice.

Specifically, this post looks at different tools to do (much) more with Twitter.

Conference structure, KM and Twitter #tags

The conference programme was organized around 3 main conference streams, a Plug and Play day and a Hackathon running in parallel to the main event. While it was a no brainer to decide the conference tag and the tags for Plug and Play and Hackathon, the design of the conference in streams and sessions presented some challenges in terms of effective use of #tags in Twitter.

On the one hand, we were expecting (as it indeed happened) quite some buzz on Twitter - and we needed to have ways to aggregate and disaggregate tweets around different conversations. On the other hand, CTA KM team was also interested in finding ways to archive and search the different tweets - around the conference #tag and specifically according to the different conference streams. Finally, we wanted to have the possibility to display specific twitter feeds on each tabs of our social dashboard.

So once we had decided a basic #tag vocabulary, with specific #tags for each session, I was faced with the challenge to find ways to:
  • Extract information from Twitter a Search - possibly a feed search results for each session #tag; 
  • Aggregate this info to display twitter feeds around each of the three conference streams; 
  • Find a way to archive and search these Tweets.

Display and aggregate Twitter search RSS feeds

This sounded complicated to achieve when I first looked at it. With the recent changes in Twitter API policy, users are no longer able to obtain any of the Twitter streams – search results, timelines of users, users’ favorites etc – in an RSS feed.

After spending some time researching and testing online what tools I could use to get a Twitter RSS feed, I found that some smart folks out there had the answer I was looking for and I was able to use some simple Google Scripts to set up a Twitter RSS feed for each session #tag search result.

Once I had created these 25 odd Twitter search feeds (one for each session #tag), I was then able to aggregate them into consolidated feeds for each of the 3 conference streams, using Yahoo Pipes. So for example, out of the Twitter search feeds for each of the 12 sessions in the Emerging Innovation stream, I was able to produce a single, aggregated Twitter feed.

Never miss a Tweet!

Once I’d solved this challenge, I was still presented with the need to find ways to archive tweets - as after a while they disappear from the search results. Plus, this Twitter archive had to be searchable, to meet the needs of the CTA team to browse and use this content in the future.

The solution here came from a brilliant post by Martin Hawksey, where he presents TAGS5.0 - a way to archive AND visualize tweets, automatically pulling results from a Twitter Search into a Google Spreadsheet.

This was indeed a great discovery and using it has proved to be of great interest and value

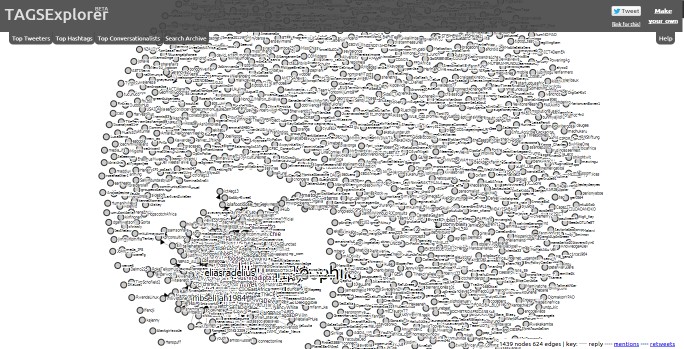
The full Twitter archive for the conference hashtag #ict4ag13 is available as a public Spreadsheet on Google Drive. You can also explore the interactive visualization of the conversations on Twitter, mapping replies, retweets and mentions, and the relations between different users. Finally, it gives you a complete Twitter archive that can be easily browsed and searched by keyword or by username.

Together with one main Spreadsheet for the conference hashtag, I’ve also repeated the process and created different Spreadsheets for:
For each of them, you can visualize the interaction and search the online archive of tweets (see on Summary tab, then Public web views).

Back up if you can

While the whole setup was quite easy, I did encounter one main technical problem. The script failed to archive several tweets for two days of the conference - maybe due to the very high volume of tweets that were generated.

Luckily I had also set up a backup for the #tag search in Hootsuite and I was the able to reconstruct the full database in the days after the event. But of course this is not ideal, as it require quite some time in moving data from one spreadsheet to the other.

Despite this, the end result is quite useful I believe, especially as it enables the preservation of the tweets for future reference and research, and to compare different events in terms of online conversation and engagement on Twitter.

I’d also like to see if the visualization of the Twitter conversation can be improved and provide a clear picture of the connections.

Any expert out there that would like to give it a try and improve the visualizations from the complete dataset?

 - 

Thursday, November 28, 2013

Tracking reach, understanding engagement - Social reporting at ICT4Ag

Over the past few weeks, I’ve been busy with the preparation and the coordination of the social reporting team for the ICT4Ag conference in Kigali. I'll blog separately about the process and learnings (actually, a lot!) in terms of both technology and people for a successful social reporting effort.

But if you are interested in discussing Twitter reach and online engagement around the event, please stay with me for a few minutes and keep reading.

The starting point for this conversation is the post that my friend and colleague Pete Cranston published few days back. I’m grateful for the questions he poses, as they couldn't provide a better framework for my reflection.

It’s two million, actually...

On one thing Pete is not not correct though. According to Keyhole, the tool we used to track the conversations around the conference hashtag #ict4ag13 (on Twitter, Facebook and Instagram) the total reach is over 2 million!

Together with the reach (defined as "the number of unique followers that a users has - and so the unique number of people that a tweet could potentially get to"), Keyhole also tracks impressions, number of posts and number of users that have contributed content around #ict4ag13. So if we look at this full picture, the headline figures are even more impressive, with over 12 million impressions, from 11,900 posts contributed by 1,272 users.

(click to enlarge image)
#ict4ag13 real-time tracker with Keyhole - 12 Oct-11 Nov. 2013
So what does it mean to reach these people? And do these numbers really matter?

On the one hand, if I look only at these figures, I am very pleased with the results - and I am indeed including these figures in my report back to CTA! And not just because I believe in ‘vanity metrics’ (in fact I don’t, as you’ll read) but for the reason that these numbers could be enough for me to say that the objective of the social reporting project - in terms of raising online awareness on the topics/sessions of the conference, update the online audience on the conference proceedings and engage them in the discussion - were met.

But I want to move beyond the numbers or - as Pete put it - "avoid the risk posed by pure, refined white sugar."

Keyhole itself provides some useful indicators that go in this direction. Indeed, it gives you insights on the contents that are shared (at the level of domains and individual links). It also provides a useful map that show where the conversation around the hashtag are happening, the demographics of contributors and the share of posts between original posts, retweets and replies.

To me these are already very interesting analytics and they provide a much richer picture of the online conversation around an event - and how users engage with it.

However, if you want to understand more about the value of social media for events and where different users position themselves on the ladder of engagement, especially when we look at Twitter conversations, I think different approaches are needed.

Tracking engagement, mapping conversations

While preparing for the event, I spent quite some time researching online for tools that could allow me to archive all the tweets around #ict4ag13, and to do some more analysis beyond the usual suspect metrics. I was looking for a free tool, and after several searches - and testing some applications - the right query string finally landed me to this post by Martin Hawksey, where he presents a way to archive AND visualize tweets, automatically pulling results from a Twitter Search into a Google Spreadsheet.

I am not going into the technical details of how this works (Martin does a pretty good job himself in explaining how to setup and use this script). As for the technical problems I have encountered, this will be in follow-up posts.

Again, I’d like to focus here on the results, and show you how different the picture looks like if you add another layer of analysis to the data available.

(click to enlarge image)


(Note - An interactive version of this visualization is available online but sometimes it may take long to load. You can hover over a node to see a summary of the data recorded in the archive. By clicking on the node you can see the conversations that person had condensed into 30 seconds)

As you can see in the image above, this visualizations shows the conversations between Twitter users around #ict4ag13 - producing a network analysis where the different nodes represent users and the connections between them is determined by the replies and conversations between them - instead of just retweets.

While this is probably not perfect - the visualization for example could be improved to have a more clear picture - I think this is very useful to evaluate the conversation around Twitter. In the case of the ICT4Ag conference, while many users contributed content, not all of them had been engaging in conversations - rather this happens amongst a core, central group of users, while many more remain at the periphery, broadcasting, engaging with the content of the conference but not really exchanging with one another.

Show off but connect the dots!

So while I am definitely using some ‘vanity metrics’ in my report back to CTA I think that a fair assessment of social media engagement around an event like in the case of ICT4Ag needs to look beyond just these numbers. It needs to map the conversations and the contents that are shared. Most important, once you have these information, it is critical to act on it and spend more attention into enlarging the conversation, to making sure that each contributor does not talk to himself but engage with others - or to put it another way, that each dot has at least a line that connects to it.

 - 

Monday, November 11, 2013

Knowledge at ICT4AG

We were active at the ICT4Ag conference organised by CTA. It was a big event. About 400 people passed through over four days, and even by the end of the fourth day around 200
(thanks to Nancy White for this photo of groups at work)
people were still prepared to spend time thinking together about what they had learnt and what kind of actions would advance the different agendas that had been surfaced

Pier Andrea Pirani trained and led the social reporting team and we were also there to both support and try to enrich the learning and knowledge sharing and try to capture some of the processes  – the conversations, any outputs of individual and shared thinking, the formal presentations and, if at all possible, some of the informal exchanges that are always at the centre of conferences and workshops. It was a busy time, for participants and us. After an introductory Plug and Play day, which we helped facilitate, and of which more in another blog, the central three days of the conference were split up into:

  • Plenary panel presentations 
  • Parallel sessions, 24 in total, where three or four people presented case-studies, projects, studies and stories and, if the presenters were able to convince people to keep to time, some discussion; 
  • Two ‘open sessions’, where the aim was to encourage collective reflection, cutting across the thematic streams which were part of the organising framework, to surface fresh perspectives and emerging trends   

Learning and knowledge sharing 

So participants at ICT4 Ag experienced a rich and varied programme, that offered a broad span of opportunities to learn new things, to deepen existing knowledge, to meet informally and exchange ideas with other people, to take part in more organised group discussion activities, participate in processes aimed at encouraging reflective thinking and the emergence of collectively sifted ways to improve the use of ICTs in Agriculture. Participants had access to detailed programme and background information from a website, a mobile phone application, a printed catalogue, presentations during content sessions and brochure material distributed by those who were presenting. Those who use and engage in social media shared in the production of a huge number of content items including tweets (8,778!), blogs, video interviews and Facebook posts
Participatory?

A daily narrative of each day was published on the site, as was a short video story. And then there were the evenings – something happening most nights, for most participants, with one ‘reception’ well fuelled by alcohol (there is a blog somewhere about alcohol and development, how for people who meet rarely, and work virtually globally, it shortcuts to more intense connections and conversations and, of course, makes it more fun!)

If my own experience is typical, all of those channels will have enabled those who participated actively to leave with an enriched understanding of trends; new ideas; which older ideas work and which don’t; deepened relationships and extended networks, as well as a range of fully and partially formed ideas about doing things differently, or doing new things.

Knowledge – or information – management 

And that is all without having a look at all the output that we and others have gathered during and since the conference. We weren't able or resourced to provide a full record of the event: 
  • If we had videoed content session we would still only be providing a small proportion of the learning represented by the recorded sessions, since there wouldn’t have been the conversations before, during and after those sessions that provided context and material for comparison. 
  • We could have documented each content session in detail: harder to absorb, but possibly a basis for later analysis for major and common ideas. 
Instead the CTA team aimed to participate fully in the event and gather material from the inside, looking to surface and record learning:
  • Four people were employed to participate in and write syntheses of the key ideas and features of the parallel content sessions. Deliberately, we aren’t looking for neutral reports of proceedings but a personal take of the material and conversations, based on our own judgement, informed by experience and, of course, our own preconceptions, based on our own imperfect understanding and knowledge; 
  • The output of from the social reporter team was aligned to those content sessions using tags identifying three main streams of work 
  • Participants were encouraged to leave ‘what next’ reflections on wall boards, which we will be sifting and sorting; 
  • In the two non-structured 'open sessions' participants were first encouraged to identify themes which had emerged, cross-cutting the formal conference structure and then envision a future within the themes which emerged and note down what could be done to support progress, actions for themselves or by other stakeholders in agriculture. 
We’ve been capturing and analysing the material, sense-making as we go along. And we’re at the stage now of trying to work out what will be really useful, for both participants and other people interested in ICT4Ag. We don’t want to generate material that is only valuable to researchers and archivists. So who needs what? 
  • One of the main audiences is participants themselves, who have a shared experience and for whom syntheses, tweets, blog stories will serve to jog memories and start reflections. 
  • Another is CTA and its organising partners, who will all value more structured, forward-looking material, to support planning and programme development and to help shape the course of ICT4Ag, as well as attract more resources to support that work and those who work in it, all ultimately aimed at improving the well-being of populations in ACP countries. 
  • There are some lessons and ideas that will be valuable to people who weren’t at the event. Although without the conversations and atmosphere of the conference those will be thinner in terms of understanding. 
The challenge, I think, is that whatever we produce will be a pale reflection of the actual event, where participations had a kind of broadband experience, multi-dimensional and intense.

So what’s our K goal? I’ve been trying to use the triple-loop learning frame as a guide 


AIM
LOOP
To capture for CTA, for reflection and planning?
Single
To share more widely, selectively, to help people practically (e.g. trip reports) …..
…..and in terms of learning (double)?
Single

Double
To identify what we think are lessons that people in the sector could use to make their own work better?
Double
To promote innovations that we think are worth watching or backing?
Single
To reflect on our own learning?
Triple
To encourage/enable others to reflect on their own action….
and learning
Double
Triple

Again, if my own experience is a guide, participants are likely to look at some of the final output, selectively, picking out those things that impressed or moved me. And while I do sometimes watch video-recorded events, I personally find that reports or summaries of action-points, however full and well-written, rarely move me to do anything. Whereas the energy from a good event continues to drive follow-up of various kinds for some time afterwards.

What about you? What kind of output from events that you didn’t attend do you find genuinely useful, and how much do you read?